
Docker isn't hard because containers are hard. It's hard because a running stack lives in a dozen places at once —
Code:
docker ps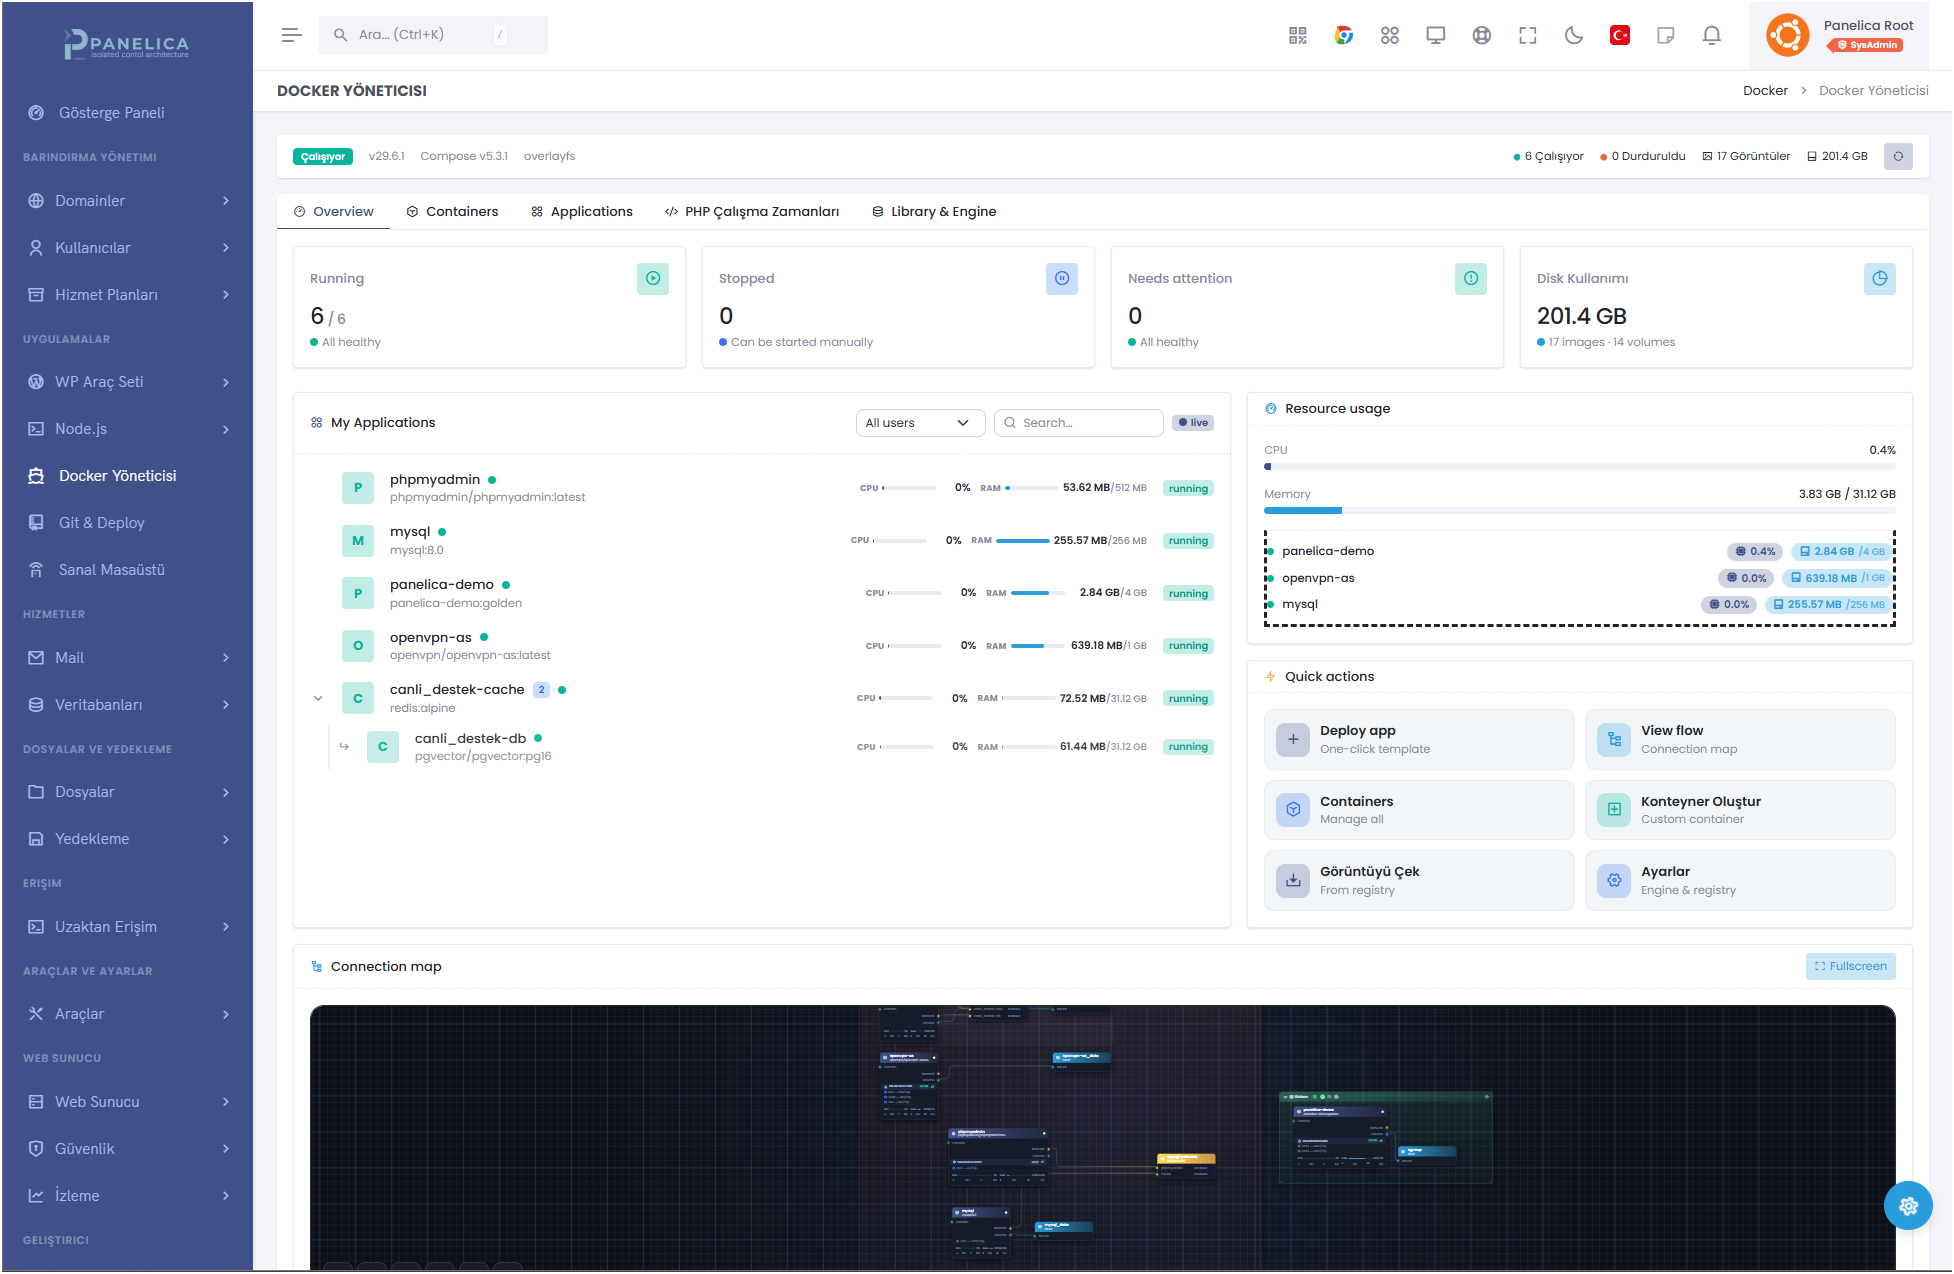
The Docker Manager opens on a single dashboard that answers the questions you actually have: what's running, what needs attention, how much disk you're using, and what each container is doing right now. Engine version, Compose version, and storage driver sit in the header; live CPU and memory stream on every row.
Five tabs organize everything without burying it:
- Overview — health cards, live applications, resource usage, quick actions
- Containers — every container as a live card or row, with inline actions
- Applications — stack-aware grouping (a WordPress + database + cache stack reads as one app, not three loose containers)
- PHP Runtimes — managed PHP-FPM images for legacy and modern apps
- Library & Engine — images, volumes, networks, and engine/registry settings
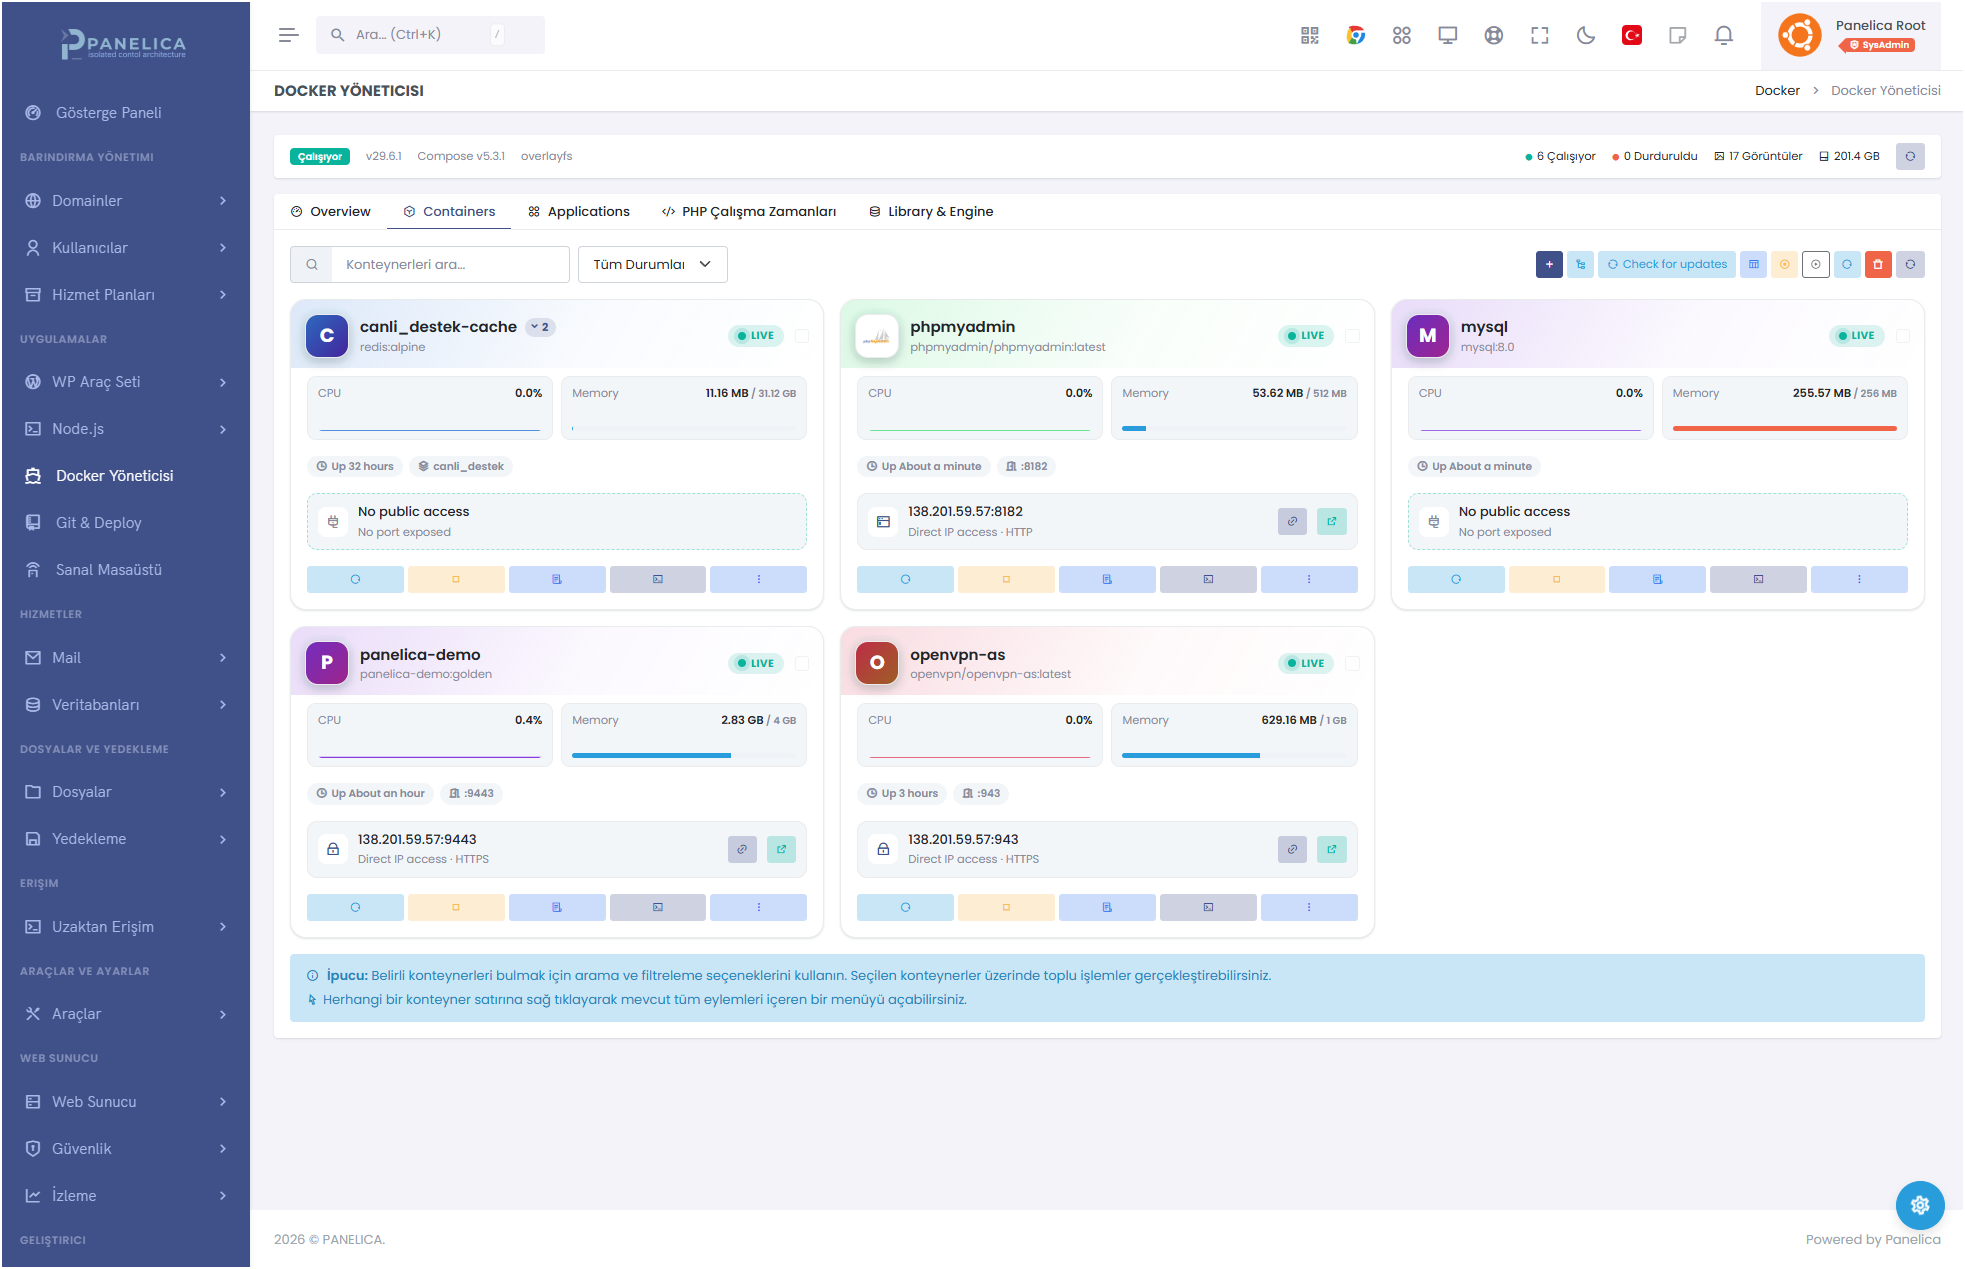
The Containers tab renders each container as a card: live CPU and memory bars, uptime, the image and tag, and — the detail most panels miss — how to reach it. Panelica auto-detects the access scheme from the container port, so an app serving TLS shows an HTTPS badge with a click-to-open link, while a database that exposes no public port is clearly marked "No public access." No guessing which port maps where. The toolbar carries bulk operations and a "Check for updates" scan that flags containers running behind a newer image tag.
This is where day-to-day work happens. Right-click any container — in the card grid, the table, or the visual flow — and the same complete menu appears, grouped into four sections so the action you want is where you expect it:
- Access — Open, Terminal, root shell, File manager
- State — Start / Stop / Pause / Resume / Restart (options adapt to whether the container is running)
- Info & links — Logs, Info, Link/Unlink domain
- Manage — Inspect, Rename, Env vars, Resource limits, Healthcheck, Mounts, Export compose, Update image, Clone, Delete
No hunting through tabs, no memorizing flags — the same menu, the same actions, everywhere you meet a container.
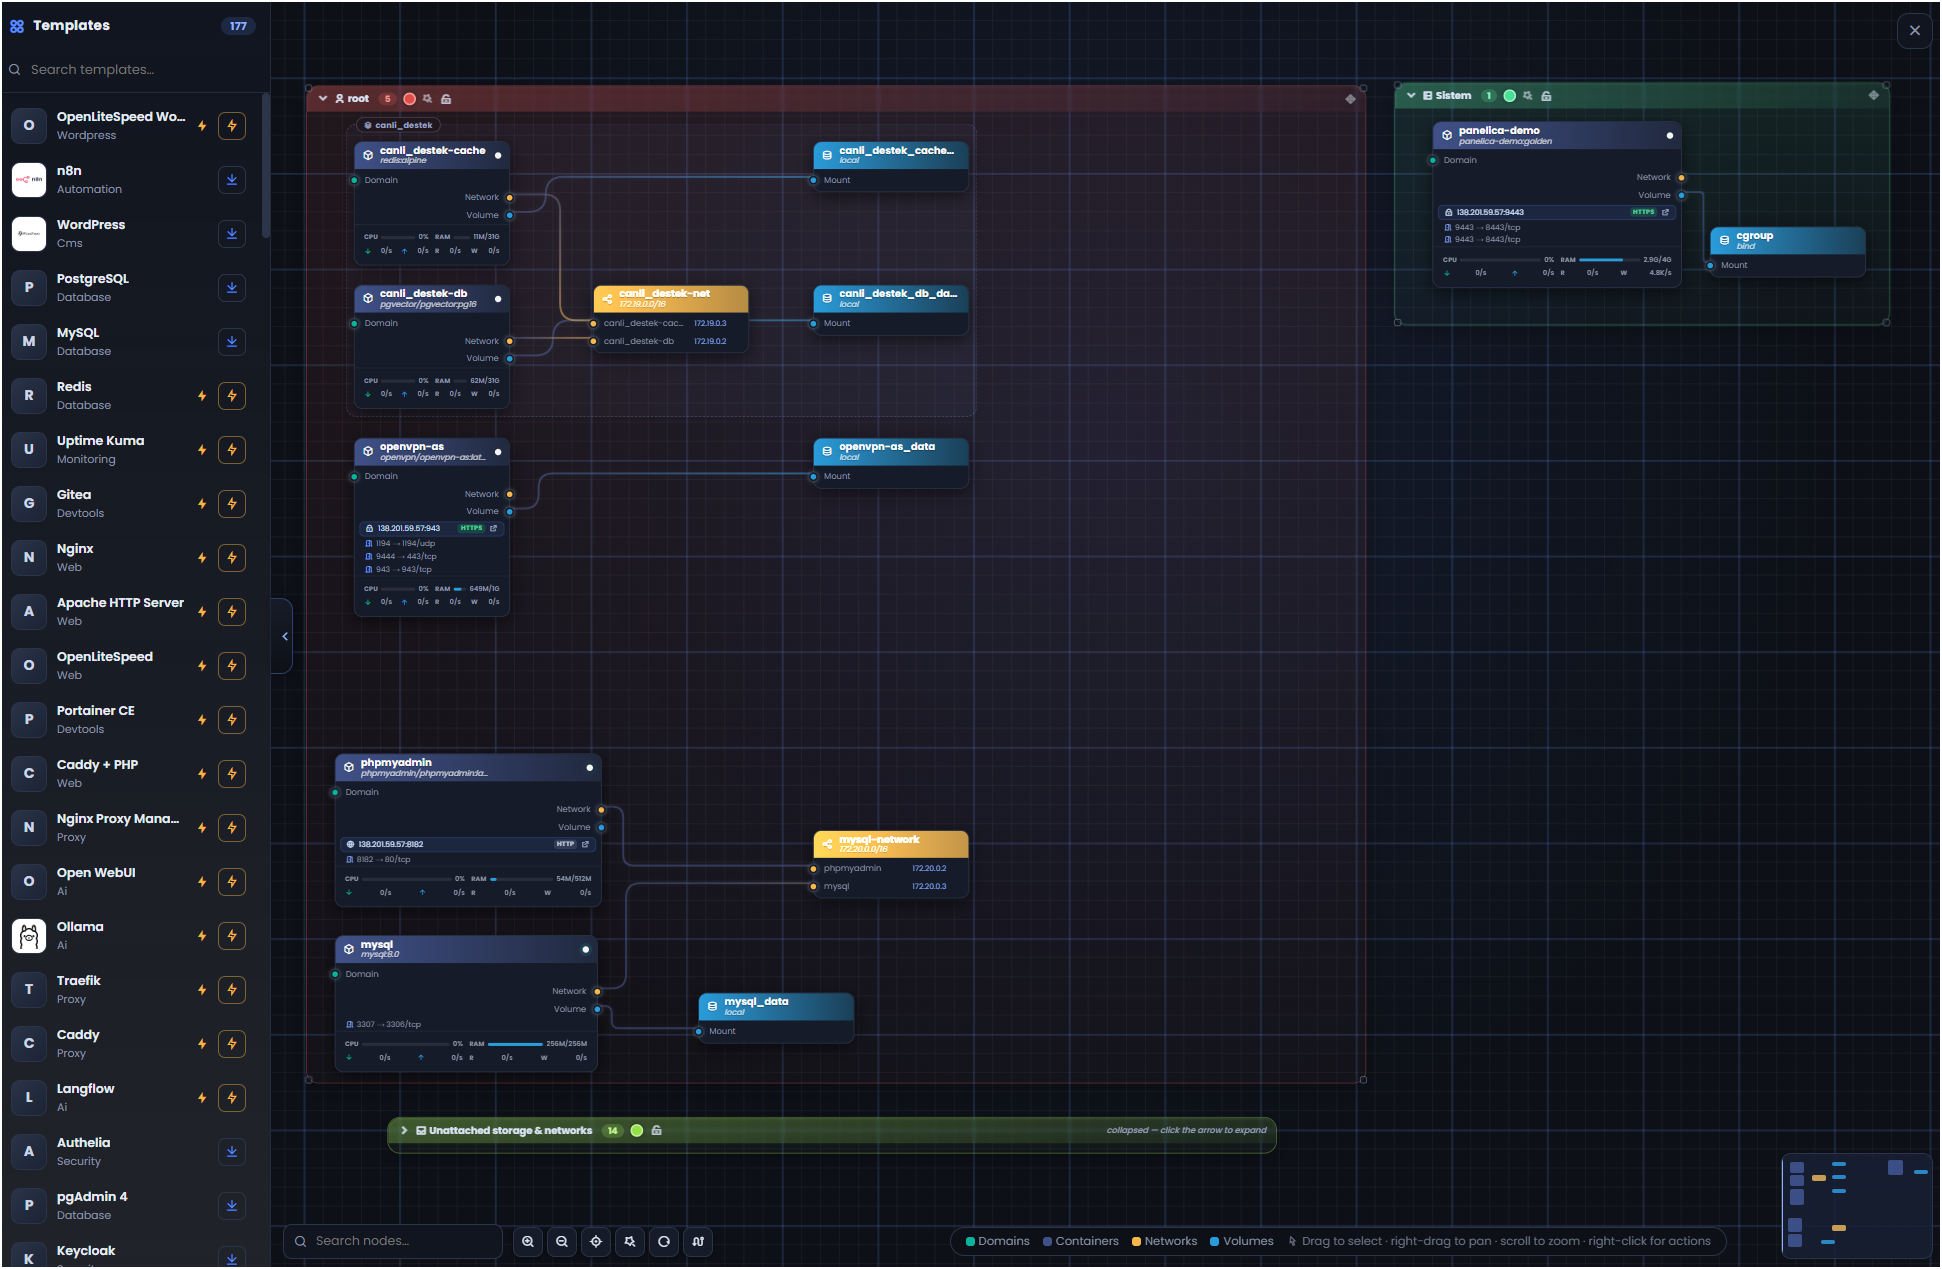
Click "View flow" and the panel reads the live state of the Docker engine and lays it out as an interactive, blueprint-style graph. Containers are grouped into owner lanes; domains route in from the left; networks and volumes wire out to the right. Color encodes type, wires represent real relationships, and a live footer shows CPU and RAM on every container node. A searchable library of 170+ one-click templates sits alongside the canvas, and a minimap keeps you oriented on larger hosts.
Every node exposes labelled, typed pins — domain pin on one side, network and volume pins on the other — so you always know what can legally connect to what before you drag anything. Drag a wire from a container's network pin to a network node and Panelica runs the real
Code:
docker network connectThe single most useful — and most commonly botched — thing an operator does is give a container a real domain with working TLS. On the command line that means editing an nginx server block, hoping the syntax is right, reloading, and hoping you didn't just take down the other sites on the box.
In Panelica it's one wire, and behind that wire is a transactional, self-rolling-back pipeline:
- Validate the request
- Check the domain isn't already linked
- Back up the current nginx config
- Auto-probe the container port for HTTP or HTTPS
- Generate the reverse-proxy block
- Run an nginx syntax test
- Reload nginx
- Health-check the backend
- Persist the mapping
If any of steps 5–7 fail, Panelica restores the step-3 backup automatically and nginx keeps serving traffic on the last known-good config. Backup-first, reload-last — that ordering is the guarantee. You cannot half-break a domain.
New image tags ship constantly. Panelica makes updating a two-click, reversible operation instead of a hand-typed pull + stop + rm + run dance that risks losing your configuration:
- Check for updates — the Containers toolbar scans your running images against their registries and flags the ones with a newer tag available
- Update image — right-click the container and choose Update image; a dialog shows the current image and lets you enter the new tag
- Recreate, preserving everything — Panelica pulls the new image and recreates the container with the same environment variables, mounts, networks, ports, and labels. Data volumes are untouched; only the image layer changes
Because the recreate carries the full configuration forward, updating a database or an app container doesn't mean re-wiring it afterward. The domain still routes, the volumes still mount, the networks still connect.
- Deploy a full app stack from a template — open the template library (170+ apps: WordPress, n8n, Gitea, Uptime Kuma, PostgreSQL, Redis, Ollama, Open WebUI, and more). Pick WordPress and Panelica provisions the app container plus its database and cache as a single, stack-aware application — grouped under one name in Applications, sharing a lane in the Visual Flow, already wired to their private network and data volumes.
- Put a self-hosted tool behind your domain with HTTPS — deploy a container, then drag a wire from a domain node to it (or right-click and choose Link domain). The nine-step pipeline backs up the current config, detects the container's scheme, generates and tests the reverse-proxy config, reloads nginx, health-checks the backend, and saves the mapping. Seconds later your domain serves the app, TLS handled, with automatic rollback if anything had gone wrong.
- Upgrade a container to a new version, reversibly — run Check for updates, right-click, choose Update image, confirm the tag. Panelica recreates the container on the new image while carrying every environment variable, mount, and network binding forward. If the new version misbehaves, the previous image is still in your library to recreate from — and your data volume never moved.
This post covers the surface. The full write-up has seven diagrams — the overview dashboard, the containers grid, the right-click menu breakdown, the Visual Flow canvas, node anatomy, the nine-step rollback pipeline, and the underlying architecture (browser canvas → Panelica backend → Docker engine + nginx, with no privileged state in the browser) — plus an FAQ section:
Full visual walkthrough with diagrams: https://panelica.com/blog/panelica-visual-docker-flow
Feedback, questions, and edge cases you'd want to see handled are all welcome below.
#Panelica #Docker #DevOps #Containers
Last edited: